To meet the strict requirements for traceability, safety, and quality in the food industry, not only large volumes of data are needed, but also careful analysis and interpretation of that data. PAT (Process Analytical Technologies) provides exactly that.
PAT is a collective term for sensors that monitor a production process inline. Instead of testing only the final product, monitoring and adjustments already take place during the process itself. PAT was developed for the pharmaceutical industry, where production processes have been monitored in real time for critical product quality parameters on a large scale for many years. As a result, both quality control and production line optimization can be carried out much faster (1). In the United States, PAT has been formalized as an optimization approach by the FDA (Food and Drug Administration) (2). With its broad implementation, the pharmaceutical industry has become the flagship example of PAT. However, this is not the only industry that can benefit from these techniques and this way of thinking. The food industry, with its large variation in natural ingredients and its focus on high and consistent quality, can also benefit greatly from real-time analysis and process control using this technology (3).
Traditionally, quality control in the food industry has been based on laboratory testing. Conducting these tests takes time, which makes it impossible to intervene directly in the process based on laboratory results. With inline PAT technology, critical parameters are measured in real time. This makes it possible to optimize processes immediately. A major advantage is that multiple sensors in a production line can be combined within a single monitoring system. As a result, quality control becomes faster, the efficiency of complex production processes increases, product quality improves, and raw materials are used more efficiently. Production processes speed up, while the amount of waste and rejected product decreases because fewer products fall outside specifications thanks to rapid adjustments. In this way, the use of PAT reduces costs while overall quality improves. And with the increasing availability of advanced sensors and associated quality models, even more applications are becoming possible.
NIR (near infrared) spectroscopy measures specific molecular vibrations, giving each molecule its own unique spectrum. NIR is often used to monitor, in real time, parameters such as moisture, fat, protein, or sugar content. By applying models, it becomes possible to predict parameters of the final product as well as variations in composition. Researchers at Wageningen Food & Biobased Research (part of Wageningen University & Research (WUR)) have demonstrated a strong correlation between the droplet size of oil in mayonnaise (an important quality parameter) and NIR spectra (4).
MIR (mid-infrared) differs from NIR mainly in the wavelengths that are used. The underlying technique is similar. MIR tracks specific chemical groups throughout the process. This is useful for monitoring processes such as fermentation. MIR sensors also exist that analyze gases. These make it possible to monitor volatile components formed during production.
Raman spectroscopy complements NIR: where NIR measures absorption, Raman spectroscopy measures inelastic light scattering. Like NIR, it provides a chemical fingerprint of a product, but it highlights different aspects. An important difference is that NIR is strongly absorbed by water, whereas water is almost invisible in Raman spectroscopy. As a result, the spectrum is not dominated by a large water peak. For aqueous streams, Raman therefore offers a significant advantage. Raman can, for example, be used to monitor fat oxidation or reveal changes in protein structure. WUR researchers have shown that Raman combined with NIR can measure lactate levels in blood within a slaughter line (5). Raman is already used to a limited extent in the dairy and oil industries, for example to monitor the fermentation process of yogurt.
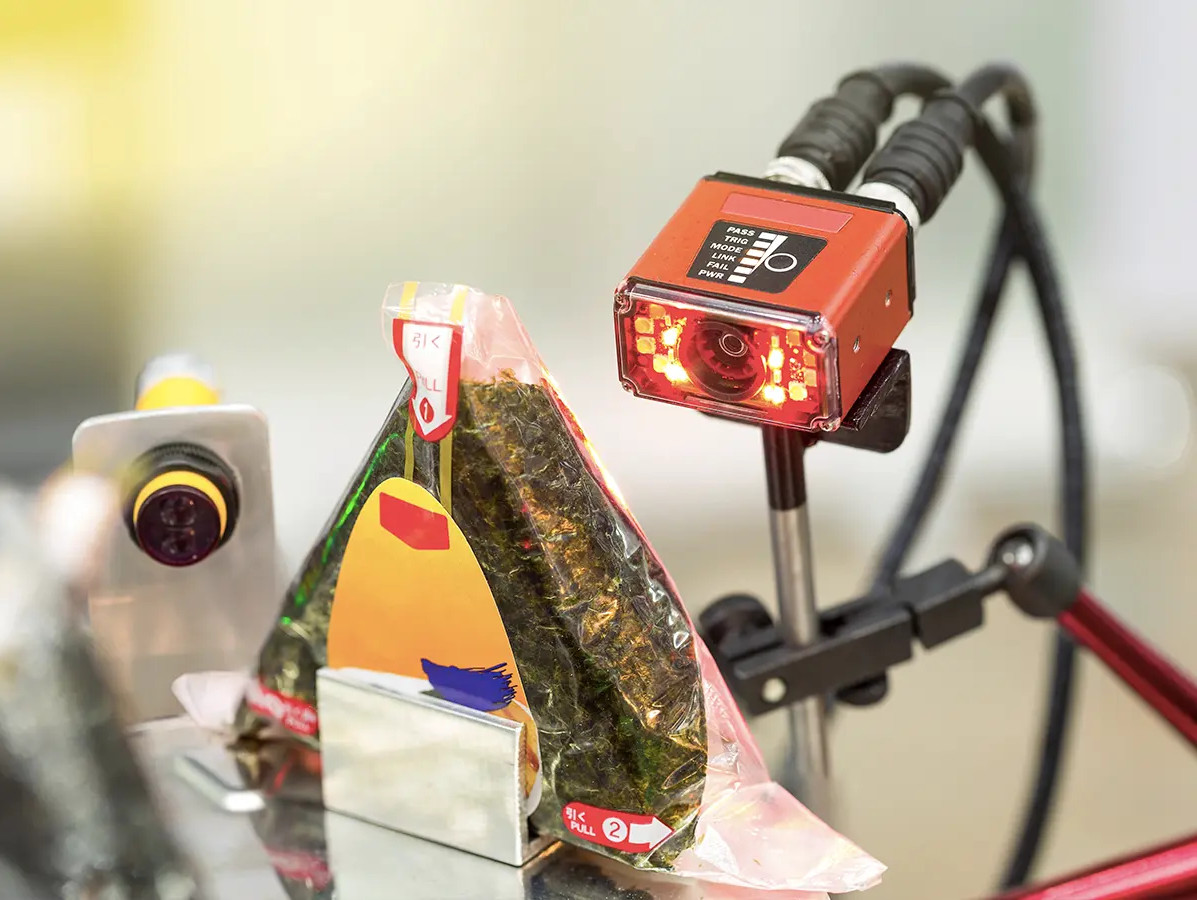
Hyperspectral cameras measure spectra (similar to NIR) at every pixel in the captured image. This makes it possible to quickly detect surface defects. They are used, for example, in sorting systems for vegetables, fruit, and plants. In addition, the cameras measure chemical composition and, perhaps even more importantly, variations in chemical composition across a surface. This makes it possible to rapidly identify defective products or contamination. Hyperspectral NIR cameras can also be used to detect process contaminants. Process contaminants are harmful components that form during heating. One example is acrylamide. Researchers at WUR have shown that hyperspectral imaging can quickly measure acrylamide levels in chips (6). This speeds up quality checks and makes it easier to limit acrylamide formation. Standard photographic cameras can also support quality control, using color as a parameter. Examples include monitoring visual aspects such as browning or assessing color uniformity across an entire product. Photographic cameras are relatively inexpensive and extremely fast.
VIS (visible light spectroscopy) is another, somewhat less accessible, method for monitoring color. Measurements take place within the visible portion of the light spectrum, roughly between 400 and 700 nm. VIS sensors allow color and color changes to be quantified. This makes it possible to monitor browning during baking or frying, or pigment degradation during production. Measuring color can also provide quantitative information on compounds such as carotenoids or chlorophyll concentrations.
3D cameras provide detailed information about the shape, surface geometry, and volume of products. Measuring these parameters in real time is extremely valuable, for example for bakery products and snacks. For an even more detailed view, inline microscopy can be used. This provides images at much higher resolution. It can be used to determine particle size distribution or detect seeds, for example. In the dairy industry, a possible application is monitoring the size distribution and dispersion of fat droplets. Fat droplet distribution is directly linked to product texture and stability, making it an important parameter to control.
Optical coherence tomography (OCT) uses light interference to analyze structures up to a depth of several centimeters, depending on the application. In seeds, for example, it can analyze structures beneath the seed coat to a depth of several millimeters. More broadly, OCT analyzes layered structures and can quickly detect defects within them. It can also monitor so-called “skin formation” in materials. OCT thus makes it possible to determine microstructure quality without taking physical samples.
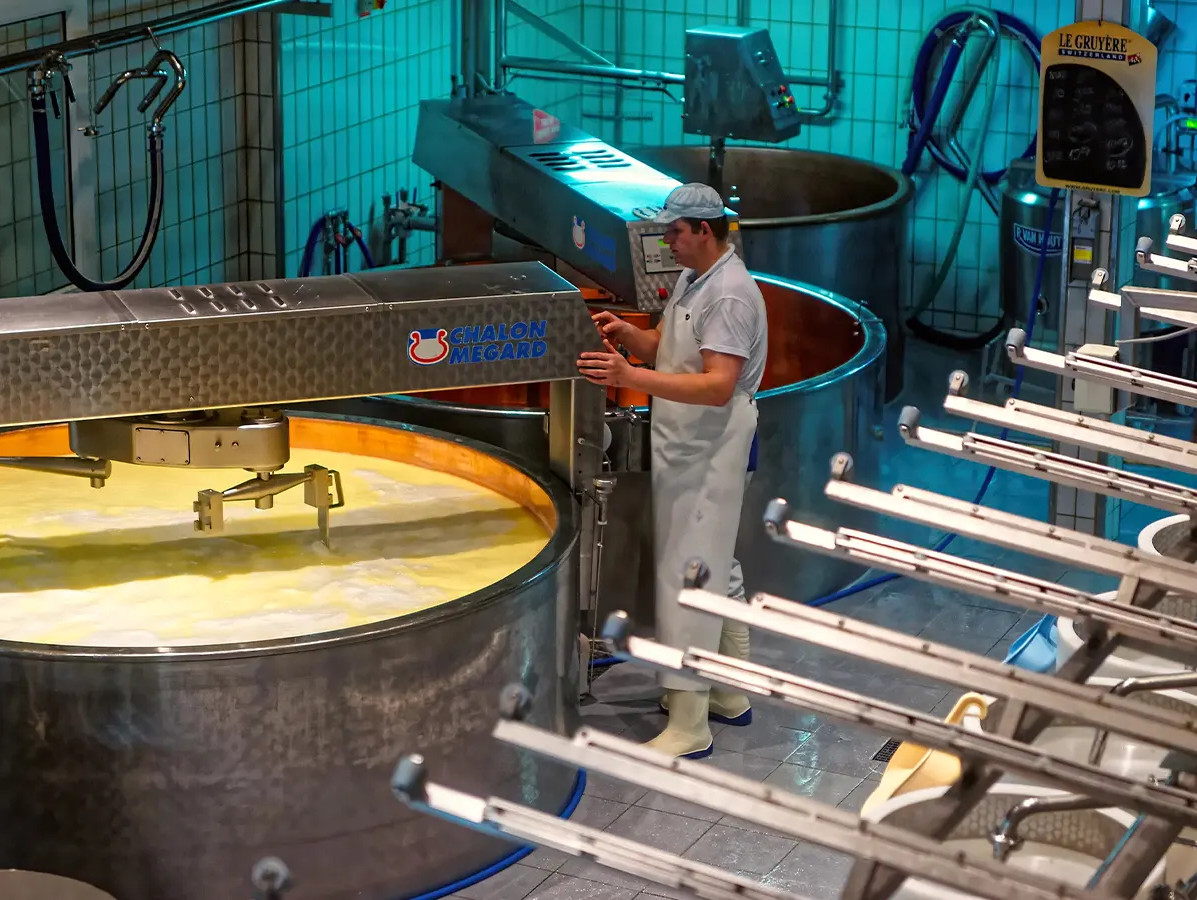
Acoustic and ultrasonic sensors are used to detect defects, cavities, or density differences. The technique relies on the propagation of sound waves through materials and the reflection of those waves. In liquids, such as fermentation processes, the sensors measure changes in viscosity. Acoustic resonance and vibration sensors detect shifts in resonance frequency, providing insight into changes in material properties. Possible applications include breakfast cereals or bakery products, monitoring dough development, or determining curd strength during cheese production.
Capacitance meters and dielectric sensors measure changes in polarity. This allows monitoring of variations in moisture and fat content, as well as phase transitions such as gelation. A major advantage over visual techniques is that capacitance and dielectric sensors also function in opaque materials. These are robust probes that are highly suitable for industrial environments.
Guided wave radar and radar level sensors use electromagnetic radiation to measure the level of liquids, slurries, and powders. They can also detect interfaces such as oil–water or water–foam boundaries. Without making contact with the material, they provide high-resolution measurements of critical quality parameters.
Impedance and conductivity sensors measure changes in electrical properties such as ion concentration, density, and viscosity. This makes them particularly useful in processes such as fermentation.
Low-field NMR (nuclear magnetic resonance) can measure the composition of a sample (for example fat, water, and sugar). It can also track phase transitions such as crystallization.
Each sensor described above provides a piece of information: chemical, physical, dynamic, or structural. The strength of a PAT framework lies in bringing all of these puzzle pieces together into a complete picture. Using chemometrics, multivariate analysis, and modeling, sometimes supported by AI, real-time models of the process can be generated. This makes it possible to steer processes proactively, rather than making reactive adjustments based only on final product quality. An example of integrated sensors in industry is a dairy production line. NIR is used to monitor composition, microwave sensors measure moisture content, and a radar system tracks the liquid level in the tank. Together, they form a robust quality control system. A bakery can ensure volume uniformity using 3D image analysis. Product color is monitored with a visual camera, while acoustic sensors safeguard texture formation. In this way, a combination of carefully selected sensors and models provides a complete view of the process. With real-time insight, adjustments can be made immediately whenever necessary.
Although the advantages of PAT in the food industry are convincing, it is still rarely used, especially compared with applications in the pharmaceutical sector. One reason for this slow implementation is that much of the research takes place at a fundamental level, usually in laboratory settings and only occasionally at pilot scale. The examples mentioned mainly demonstrate what is possible ‘in principle’. Applying PAT in the food industry presents real challenges. Raw materials show natural variation, processes are often continuous rather than batch-based, and production environments involve high temperatures, high humidity, and cleaning agents with extremely high or very low pH levels. In addition, the pharmaceutical industry is far more lucrative and profitable than the food industry. This makes it considerably more difficult to translate laboratory results into practical solutions for food processing environments. Careful consideration is needed when selecting sensors, integrating them into processes, and ensuring long-term stability under production conditions.
Data on their own have little value. It is essential that the collected information is combined into models that support decision-making by management, operators, or automated systems. This requires a solid data infrastructure. Real-time analyses must combine these models into a coherent overall picture. This demands high-quality models capable of handling process variations and possible drift in sensor signals over time.
Part of the challenge of successful implementation lies in organizational and knowledge-related aspects rather than in the technology itself. Expertise across a wide range of disciplines is required. Implementing PAT calls for a combination of knowledge in food processing, sensor technology, data modeling, and engineering, and this combination of expertise is still difficult to find. The new BioSPEC initiative, combined with the Food-Tech facility in Wageningen, offers promising opportunities. It gives companies the chance to test PAT solutions and thereby improve quality, efficiency, and sustainability in the food industry.
Sources
(1) https://pubs.acs.org/doi/10.1021/op500261y
(2) www.fda.gov/media/71012/download
(3) www.sciencedirect.com/science/article/abs/pii/S0924224412000933?via%3Dihub
(4) At-line and inline prediction of droplet size in mayonnaise with near-infrared spectroscopy - ScienceDirect
(5) NIR and Raman as a PAT tool for meat industries: An attempt towards inline lactate content prediction - Puneet Mishra, Theo Verkleij, Esra Kurt, Jelmer Nibbelink, Sjaak Wisse, Ronald Klont, 2025
(6) Portable and handheld hyperspectral imaging for non-destructive acrylamide prediction in ground potato crisps – ScienceDirect
(7) www.sciencedirect.com/science/article/pii/S0165993621000285
Source: Vakblad Voedingsindustrie 2026
Magazine Voedingsindustrie has been made possible in part by:


© COPYRIGHT 2026 VOEDINGSINDUSTRIE | ALLE RECHTEN VOORBEHOUDEN
Powered by Wallbrink Crossmedia © 2026