
Your company is fully committed to sustainability. That’s great, of course. But how do you make your efforts visible to the outside world? Which measures contribute the most to reducing emissions? And how do you know which interventions create the greatest impact? It’s not just you seeking answers to these questions; consumers, the market, and the government all demand transparency. A new tool can help with that.
It’s a significant challenge for companies to demonstrate that their business, supply chain, and processing are truly sustainable. Quantifying sustainability and identifying possible interventions to improve it require insights and data—lots of different data. This includes information on the impact of raw material production and transport, processing and storage methods, packaging types, and more.
This data is often limited within companies. Well-known impact assessment methods, such as life cycle analysis (LCA), do rely on detailed data and provide precise measurements, but they also have limitations. For example, interpreting the results requires expertise, the methods typically focus on the current situation, and they offer little insight into the effects of future sustainability measures. To simplify this process, Wageningen Food & Biobased Research developed a new calculation tool. The ‘AgroChain Greenhouse gas Emission calculator’ (ACE calculator) not only estimates the footprint of a food product but also evaluates the potential impact of the interventions you would like to take.
The ACE calculator quantifies impact data across the supply chain, including the CO2 footprint, energy consumption, and water usage for various crops and raw materials from different countries of origin. It incorporates data on transportation, packaging, climate-controlled storage, processing steps, auxiliary materials, and different energy sources. The tool can be customized with company-specific data, such as transport distances, storage durations, and energy and water consumption during processing. It is, of course, important that the data closely reflects real-world practices.
For the food industry, the calculator can be tailored to specific processing activities and steps. It allows for the combination of multiple raw materials, making it possible to analyze composite products. And for fractionation steps, the resulting impacts can be allocated to food products using various methods. This is especially important for supply chains and processes that generate by-products. Allocation based on volume, economic value, or the replacement of an existing material are among the possibilities.
For parts of the chain where company-specific data is unavailable, estimates of the potential impact can be provided if desired. The calculations make corrections for food losses within the supply chain. To assess the effects of possible sustainability measures, the ACE calculator includes functions to analyze alternative supply chains and processing methods. It features data on variations such as final product forms (slurry vs. powder), ingredient choices (plant-based or less refined ingredients), energy sources, packaging materials, processing technologies, storage methods, transport modes, countries of origin, supply chain configurations, and end-of-life options (including waste streams and packaging materials).
The results generated by the ACE calculator reveal which parameters have the greatest influence on outcomes and identify the activities, raw materials, and other factors that contribute most to your sustainability impact. These factors may fall within or outside your company’s direct scope.
Reducing energy consumption and CO2 emissions has been a key goal of the Dutch food industry for years. Recently, access to water of the right quality has also become a priority. Various solutions are available to meet these goals. For example, linking heat and cooling streams, using heat pumps, and adopting alternative technologies for energy-intensive processing steps can significantly reduce both energy and water consumption. These possibilities can be integrated into sustainability analyses.
Sustainability is a broad concept with many variables to consider. It’s useful to be aware of the fact that improving one aspect of sustainability can sometimes lead to negative effects in other areas. Involve different departments within your company in developing your sustainability strategy, identify any bottlenecks, and work together to make the best decisions for your business. The same applies to the supply chain: structural sustainability improvements require collaboration to identify and implement the right measures. Quantifying the impacts and determining how they can be further reduced through interventions provides objective insights to accelerate sustainability efforts.
The ACE calculator was used to assess whether locally produced apple juice in glass bottles has a lower impact than juice made from Polish concentrate packaged in Tetra Paks. Juice from concentrate involves a longer supply chain and more processing steps compared to Dutch apple juice. Both supply chains were modeled in the ACE calculator, and the CO2-equivalent impact, as well as energy and water use, were analyzed. The following conclusions were drawn:
Potential reduction measures:
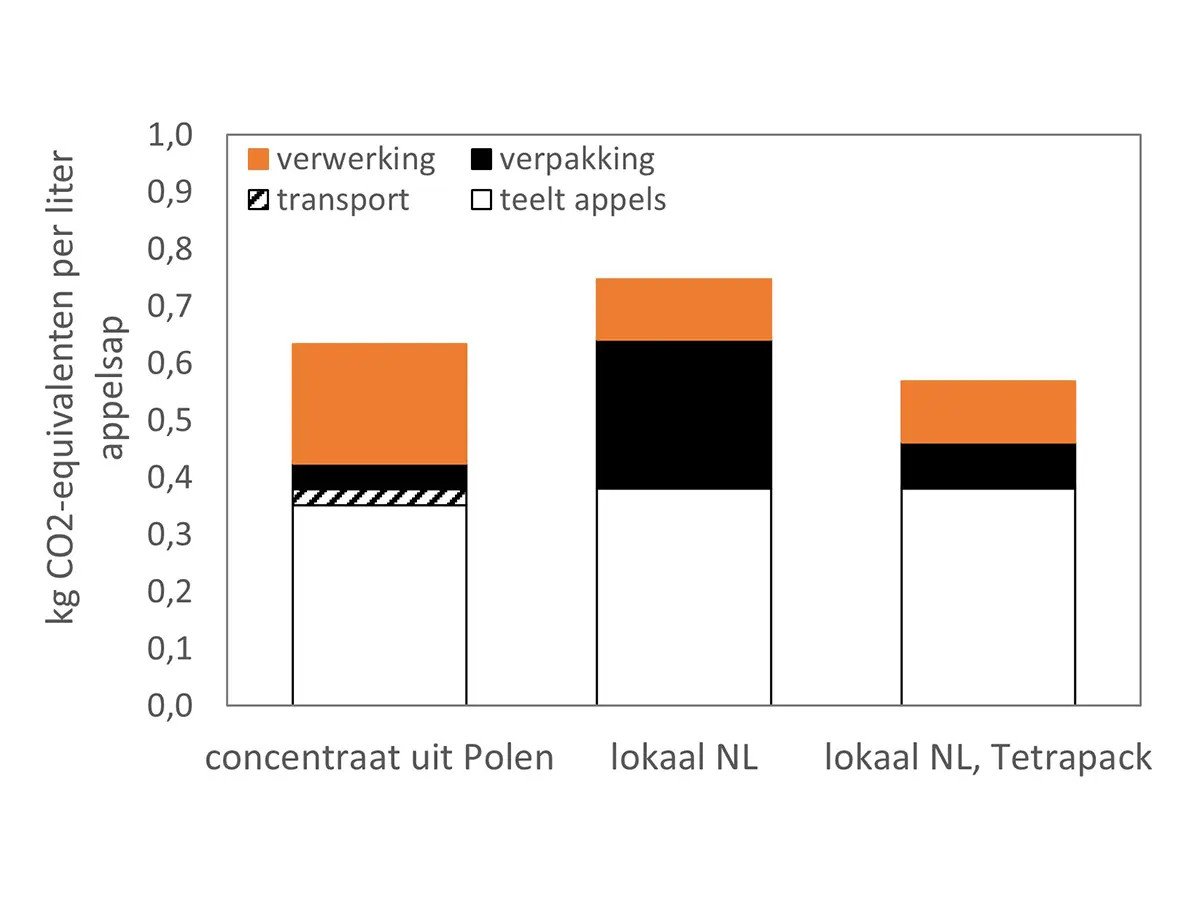
Carbon footprint in kilograms of CO2-equivalents per liter of juice for apple juice from an international supply chain (Polish concentrate), apple juice from Dutch apples in glass bottles (local NL), and apple juice from Dutch apples in drink cartons (local NL, Tetra Pak).
Ready to get started youself? A limited version of the tool, focused on CO2 impact, is available on the WUR website. Are you interested in prioritizing measures that will help you become more sustainable by gaining insights into the most effective interventions for your specific products and supply chain? Join the Kennis op Maat initiative ‘Duurzaamheid Begrepen,’ where company case studies are developed using the latest ACE calculator. Contact us to participate.
Source: Vakblad Voedingsindustrie 2025
Magazine Voedingsindustrie has been made possible in part by:


© COPYRIGHT 2026 VOEDINGSINDUSTRIE | ALLE RECHTEN VOORBEHOUDEN
Powered by Wallbrink Crossmedia © 2026