
Comparing the climate impact of protein sources takes more than emissions figures alone. What do you include in the calculation? And are you comparing a kilogram of caught fish with a kilogram of edible product? Research by WUR and RIVM shows why these choices matter. Processing, refrigeration, and packaging count too.
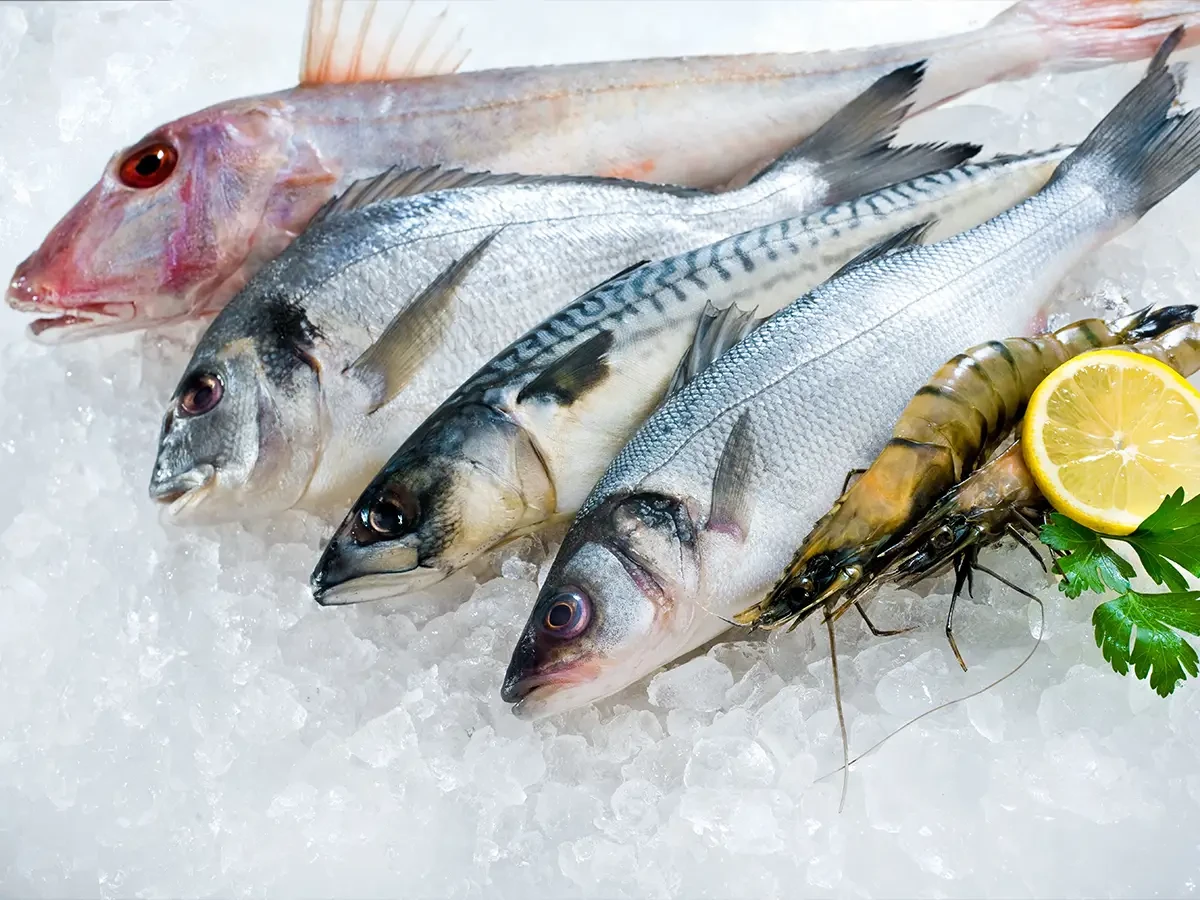
Wageningen University & Research and the National Institute for Public Health and the Environment studied climate impact and nutritional value. They compared fish and other seafood products with one another and with other foods. Herring, sardines, mackerel, and certain shellfish performed relatively well in the comparison. Their climate impact is sometimes comparable to that of protein-rich plant-based foods.
The researchers used a life cycle assessment, or LCA. For wild-caught fish, the calculation starts with the journey to the fishing grounds. Fuel plays an important role here. Refrigerant leaks can also have a substantial climate impact.
The researchers then map the rest of the supply chain. This includes transportation, processing, breading, and packaging. They also account for retail, home preparation, and waste treatment.
Where possible, the researchers use real-world data, such as fuel consumption figures. When these are unavailable, they use standard values in accordance with existing guidelines. They convert emissions of different greenhouse gases into CO₂ equivalents. This allows them to compare the climate impact of different products.
Climate impact varies by fish species and is linked to the fishing method. Pelagic species, such as herring and mackerel, swim in large schools in open water. This allows fishing vessels to catch large quantities at once, using relatively little fuel per kilogram.
For bottom-dwelling species, fishing vessels often drag nets along the seabed. This requires more energy and contributes to a higher climate impact. According to the study, however, that impact remains lower than for beef.
Mussels and oysters also have a relatively low climate impact. However, inedible shells account for a large share of their weight. The researchers therefore compare the edible portion of all products. This also accounts for bones, fish bones, and internal organs.
Lead researcher Jonna Snoek emphasizes that the calculated values have a margin of error. She says the study primarily provides insight into how products rank relative to one another.
Source: SeaNext
Magazine Voedingsindustrie has been made possible in part by:


© COPYRIGHT 2026 VOEDINGSINDUSTRIE | ALLE RECHTEN VOORBEHOUDEN
Powered by Wallbrink Crossmedia © 2026


